Performance
Profiling, query time, memory and the measurements worth believing.
Updated 8 September 2026
-
4 min read
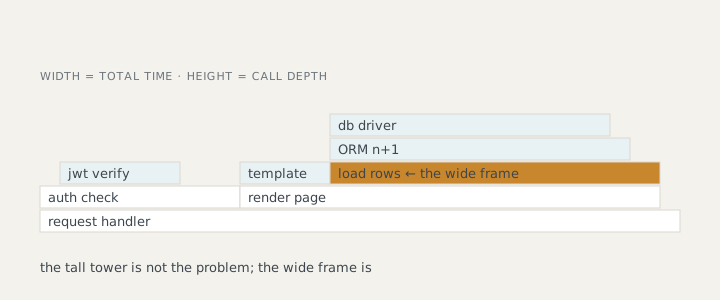
Profile before you optimize: reading a flame graph without guessing
Misinterpreting a flame graph is easy. The x-axis is not time, the boxes represent sample proportion, and to make it worse, your sampling conditions affect what you see. This article…
-
4 min read
The Slow Query Nobody Notices: Finding It Before Your Users Do
Slow performance is often a result of a query pattern that appears harmless on its own, but grows increasingly slow as the volume of data and traffic increases. It is easy to overlook…
-
3 min read
Recognise the Pattern of Memory Leaks in Python
Not every rising memory graph signifies a leak. If retained object counts and memory usage keep increasing with repeated identical operations, without ever plateauing, you likely have…
-
3 min read
Run a Load Test That Matters: How to Predict Real-World Behavior.
Most load tests are untrustworthy because the flawed tests model the wrong traffic, stop at the wrong time, and report on irrelevant metrics. Predictable load testing only works if it…
-
4 min read
Cold Starts in Serverless Architectures: The Anatomy of Startup Delays
Cold starts are not just an annoyance for developers dealing with short intervals of server downtime. They are actually a chain of delays, each one a distinct part of the process that…